Disinformation in Taiwan: International Versus Domestic Perpetrators
By: Emily Walsh
Jan 20, 2020
Taiwan held its Presidential and Legislative Yuan elections on the 11th of January. In the weeks leading up to the election, several news agencies including the New York Times, the Washington Post, and NPR reported on disinformation campaigns, largely by the Chinese government, targeting the Taiwanese people before they went to the ballot box. The re-election of President Tsai Ing-wen was seen as a failure of the Chinese pressure campaign and a rebuke of China as a whole by the Taiwanese people. In this Graph of the Week, we use the V-Dem Country Graph tool to show various types of misinformation present in the Taiwanese political system from 2000 to 2018.
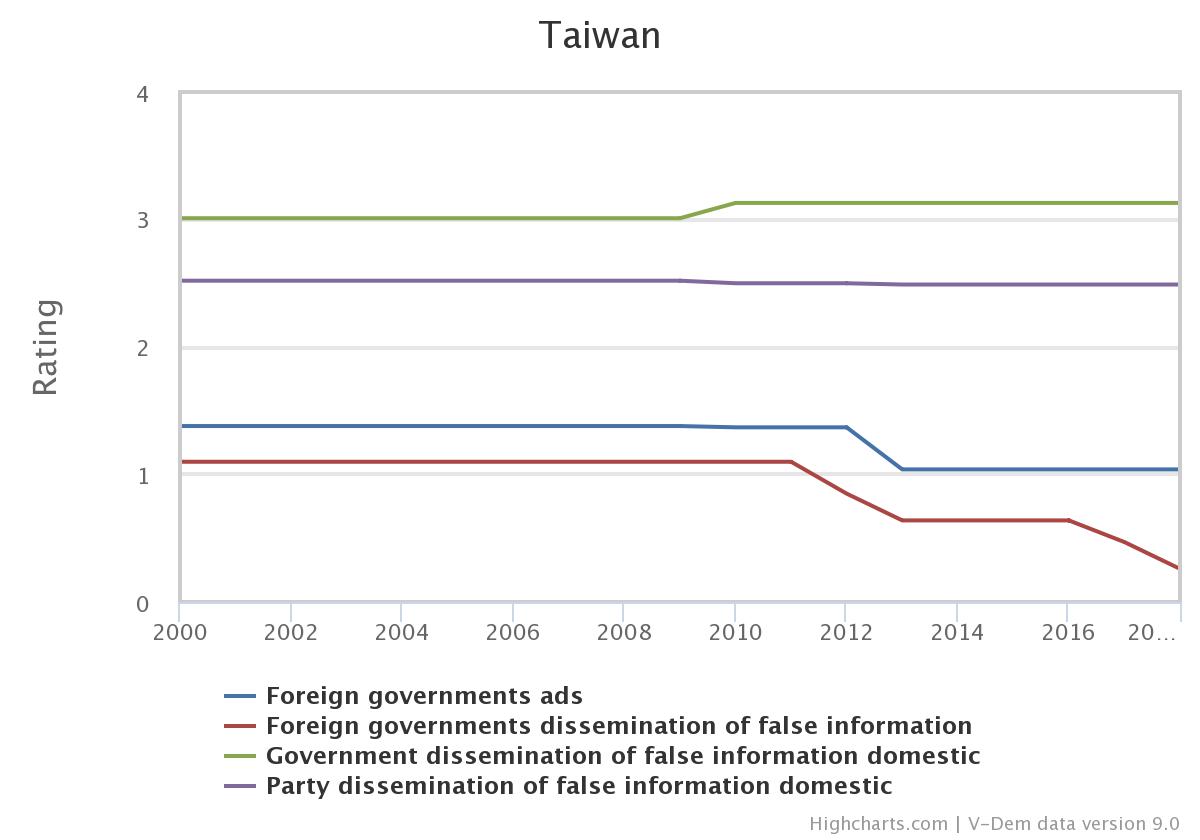
A new set of indicators on social media and disinformation collected by the Digital Society Project were added to the V-Dem dataset for the first time in 2019! The graph below plots four of these indicators: ‘Government dissemination of false information domestic’, ‘Party dissemination of false information domestic’, ‘Foreign government dissemination of false information’, and ‘Foreign government ads’. All four indicators are coded on an interval scale from 0 (often and across all policy areas) to 4 (never), reflecting the standard V-Dem practice of higher values representing a more democratic setting.
The graph reveals that the practice of spreading false information in Taiwan is commonly carried out by foreign governments across all policy issues. Since 2011 the score of ‘Foreign government dissemination of false information’ has gone from an already low score of 1.1 to 0.26 - a change of almost one whole interval in less than a decade. Likewise, more ads are being bought by foreign governments now in Taiwan than in 2000. Meanwhile, the practice of spreading misinformation is not a common occurrence for domestic actors including the Taiwanese government and major political parties, with scores hovering around 3 and 2.6 respectively.
To explore these indicators more in depth or to see their values in other countries, visit v-dem.net to access all of V-Dem’s free analysis and graphing tools!