Equal distribution of resources index
By: V-Dem Staff
Feb 20, 2017
The day was initiated in 2009 and recognizes the need to address issues such as poverty, exclusion, unemployment, gender inequality and access to social well-being and justice for all. This week’s graph examines some of the regional trends in V-Dem’s Equal Distribution of Resources Index, which captures many of the principles celebrated on this day.
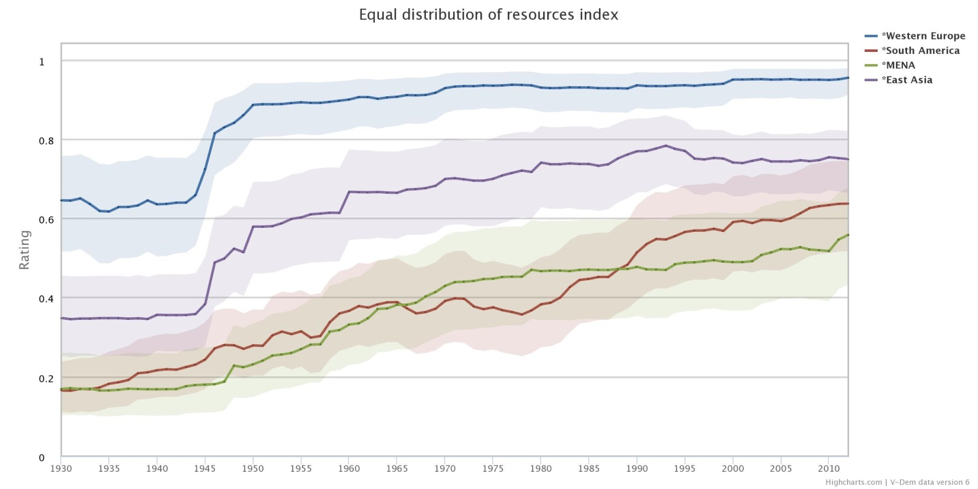
By using the Variable Graph Tool, we can compare the development of the Equal Distribution of Resources Index between regions. This week we look at Western Europe, South America, East Asia and the MENA Region. The Index measures to what extent resources – both tangible and intangible – are equally distributed in society. For individuals to effectively exercise their rights and freedoms, their basic needs such as food, water, housing, education and healthcare must be met. Additionally, high levels of resource inequality undermine the ability of poorer populations to participate meaningfully in a society. A higher value on the Index indicates a more equal distribution of resources in the region.
Equal distribution of resources in Western Europe increased significantly immediately after the Second World War and has since continued on the same trajectory. East Asia also experienced its biggest increase in the late 1940s, however not reaching the same levels as in Europe, and has since the mid-1990s stayed around the same level. The MENA region continuously increased after the Second World War as well, however with a lower increase since the 1980s. Equality in South America increased slightly from the 1930s to about 1960, where it remained roughly constant until the late 1970s. Coinciding with widespread democratization in the region in the 1970s and 1980s, equality in South America has since steadily risen.
To learn more about the Equal Distribution of Resources Index in different parts of the world, use the V-Dem Online Analysis Tool on V-Dem.net.