Political Participation of Women Over the Last 100 Years
By: V-Dem Staff
Jan 03, 2019
In 2018, the centenary of the end of World War I drew much attention to peace and conflict research. Now in 2019, several centenaries will focus on one of the most unintended outcomes of WWI – the adoption of women’s suffrage.
Not only Sweden, but also Germany, the Netherlands, Belgium, Austria, Russia and several other countries will celebrate 100 years of the implementation of women’s right to vote in 2019. Even for women in New Zealand, which was thefirst self-governing colony in the world in which women were given the right to vote(in 1893) – 2019 is a special year since it marks a hundred years since they received the right to stand for election into parliament. Therefore, V-Dem’s Graph of the Week will focus on the political participation of women across the globe over time.
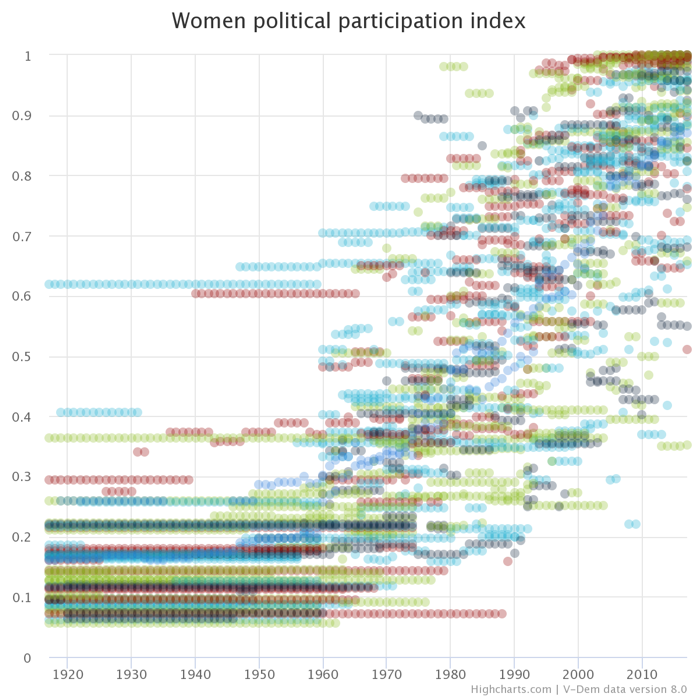
For this graph we used the Scatter Chart tool to illustrate the values of the women political participation index (zero to one) between 1919 and 2017. As can be seen in the graph by a large number of dots that indicate lower values, 1919 only marks the beginning of women’s political participation. That is because women’s political participation is understood to include women’s descriptive representation in the legislature and an equal share in the overall distribution of power. However, the figure shows a discernible, positive trend towards higher female political participation globally. Nevertheless, the number of countries with lower values remind us that women’s political participation is more than the right to vote and that the establishment of gender equality remains an important task for all countries from the perspective of participatory democracy, one of the high-level principles of a democratic system.
To learn more about our five high-level principles of democracy, please visit v-dem.net.